Agent Observability: Hooks, Alloy, and Grafana
> We wired Claude Code and Codex into one Grafana stack with OpenTelemetry and Alloy, then used traces and logs to find and fix agent behavior issues at the source.
Agent systems fail in weird ways.
Sometimes the model is the problem. Sometimes the tool is the problem. Sometimes your MCP server is fine, but the agent chose the wrong specialist, or spent half the session doing shell work you did not expect, or silently burned cost in a loop that looked productive from the outside.
If you cannot see the difference, you are not really operating an agent system. You are guessing.
So we built an observability stack for our own workflow: Claude Code, Codex, Claude hook events, Codex notify events, native OpenTelemetry, Grafana Alloy, and Grafana Cloud on the other side.
The interesting part is not “we made a dashboard.” The interesting part is that we had to split telemetry into two different streams because no single feed gave us the whole picture.
The Problem: Agent Telemetry Is Fragmented
Modern coding agents already emit some telemetry. That helps, but it is not enough.
Native OTEL is good at answering questions like:
- How many requests did we make?
- How much did a session cost?
- Where are the spans and traces?
- Did latency spike?
It is much worse at answering questions like:
- Which MCP server did the agent lean on?
- Was this failure in
Bash, a built-in file tool, or an MCP call? - Which skill actually activated?
- Which subagent type got dispatched?
- Was the session doing useful work, or just thrashing?
That second class of question lives closer to hooks than traces.
But the inverse is also true: some of the most important performance questions live closer to traces than hooks.
If you want to know where latency actually accumulated, which spans were slow, or whether the session burned time in model calls versus tool execution, you need trace data as well as semantic events.
The Architecture We Ended Up With
We run two telemetry paths side by side.
Claude Code
  native OTEL -> Alloy -> Grafana Cloud
  hooks        -> send_event.py -> Grafana Cloud Loki

Codex
  native OTEL -> Alloy -> Grafana Cloud
  notify hook -> codex_notify.py -> shared Loki schema
That split is deliberate.
It is also asymmetric. Claude Code gives us a much richer lifecycle hook surface. Codex gives us native OTEL plus a notify surface, so we normalize thinner turn-completion events into the same log schema instead of pretending both runtimes expose the same controls.
Native OTEL gives us the baseline stream: logs and traces from the runtime itself, plus metrics where the runtime actually emits them.
Hook and notify events give us the semantic layer: things like PreToolUse, PostToolUse, PostToolUseFailure, UserPromptSubmit, SubagentStop, SkillActivated, and the classified metadata we actually care about when debugging agent behavior. Claude Code contributes the richer event stream here. Codex contributes a thinner but still useful normalized stream.
Why Hooks Exist At All
Our hook pipeline enriches events before they hit Loki.
Instead of just saying “a tool ran,” we classify the event into fields like:
tool_type: builtin, mcp, skill, agent, bashmcp_server: which MCP backend handled the callbash_cli: the shell command familysubagent_type: what kind of specialist got dispatchedagent_tool: whether the source was Claude Code or Codex
That means we can ask questions that matter operationally:
{service_name="claude-code-hooks"} | agent_tool="codex-cli"
{service_name="claude-code-hooks"} | tool_type="mcp"
{service_name="claude-code-hooks"} | json | bash_cli="git"
Those are not vanity fields. They are the difference between “the agent felt slow” and “the agent spent the last ten minutes in shell-heavy git operations with a high tool failure rate.”
One implementation detail that looks stranger than it is: the shared Loki stream still uses service_name="claude-code-hooks" as the label even when the event came from Codex. The real split between runtimes happens on agent_tool.
Why Alloy Sits In The Middle
Grafana Alloy is not just a forwarder in this setup. It is the policy boundary.
We point the native OTEL stream from Claude Code and Codex at a local Alloy proxy on localhost:4318, then let Alloy clean up the payload before forwarding it to Grafana Cloud.
That matters because raw agent telemetry is full of high-cardinality fields that are useful for analysis but terrible as indexed labels:
session_idprompt_id- token counts
- durations
- tool parameter blobs
If you index everything, you get a label explosion and a bad day.
So Alloy does three things for us:
- Keeps a very small set of low-cardinality labels indexed.
- Moves noisy but useful fields into structured metadata.
- Drops pure noise entirely.
The important idea is simple: observe more, index less.
Why The Hook Stream Bypasses Alloy
The hook stream is already shaped for Loki.
By the time send_event.py pushes an event, we have already decided which fields deserve label treatment and which belong in the structured JSON body. That stream goes straight to Grafana Cloud’s OTLP gateway instead of taking another pass through Alloy.
So the system has a clear division of labor:
- Alloy tames the raw native OTEL stream.
- Hook enrichment makes semantic events queryable.
That keeps the architecture simpler than trying to force everything through one path.
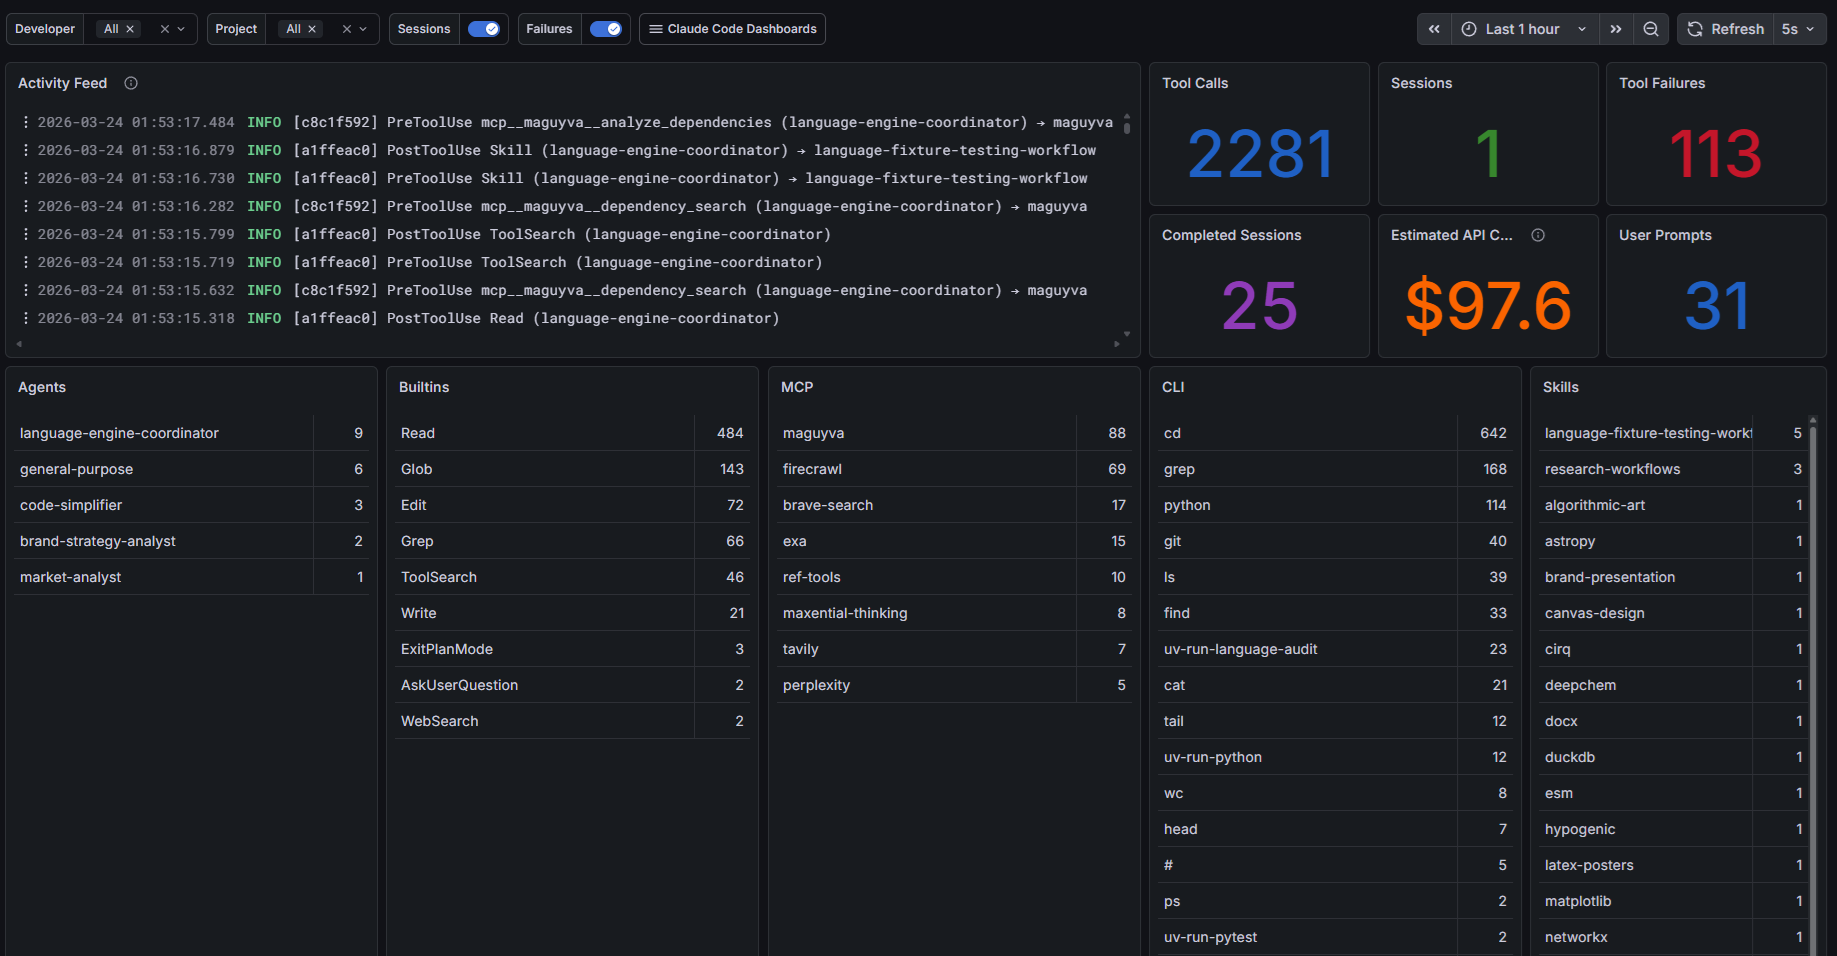
What The Dashboard Actually Shows
The screenshot below is from one of the observability dashboards behind our agent workflow. It is not a benchmark, and the numbers are just a point-in-time slice. The point is the shape of the data: activity feed, tool calls, failures, prompts, and breakdowns by agent, built-in tools, MCP usage, shell commands, and skills.
The useful part is that this dashboard lives on the same Grafana stack as the rest of the agent telemetry. We can filter by source agent and tool family and look across runtimes without inventing a different observability story for each system.
Why Traces Matter More Than They First Appear
Logs tell us what category of work happened. Traces tell us how the work unfolded over time.
That distinction matters in agent systems because “slow” is too blunt to be useful.
A trace can tell us whether the pain came from:
- model latency
- tool execution time
- repeated retries
- one especially expensive MCP interaction
- a long tail of small operations that looked harmless in isolation
In practice we use the hook stream and Tempo traces together.
- Hook logs answer: what kind of thing happened?
- Traces answer: where did the time go?
The combination is what turns observability from a dashboard into an explanation.
Where Codex Fits
Codex is part of the same stack, but it is not identical to Claude Code.
For Codex we wire two pieces:
- Native OTEL from Codex into Alloy
- A notify webhook into
codex_notify.py, which maps turn completions into the same Loki schema we use for hook events
That gives us a unified filter like agent_tool="codex-cli" inside the same log stream.
The honest caveat: Codex’s notify payload is currently thinner than Claude Code’s hook payload because it is not the same kind of integration surface. In our setup today, Codex turn completions can be normalized into the shared schema, but rich tool-by-tool extraction is still better in the native OTEL stream than in the notify bridge.
That is not a reason to avoid the post. It is the point of the post. Real observability systems are assembled from imperfect signals.
Grafana Over MCP Changes The Game
The bigger shift is that Grafana is not only a place humans visit in a browser.
In this repo we also expose Grafana through MCP. That means an agent can query Loki, Prometheus, and Tempo directly instead of waiting for a human to manually inspect the dashboards first.
That turns observability into an active input to the workflow.
An agent can ask:
- Which tool families failed most in the last hour?
- Which MCP server dominated a session?
- Did recent changes reduce tool failures or just move the work into more shell-heavy paths with the same mistakes?
- Which traces show the highest latency or repeated retries?
Once you have that, you are very close to a self-improvement loop.
From Dashboard To Feedback Loop
This is the part we find most interesting.
Once the observability stack is queryable from the agent layer, telemetry stops being a passive reporting surface and becomes a control signal.
The loop looks like this:
- Agent activity emits traces, metrics, and enriched hook logs.
- Grafana stores the evidence in Loki, Tempo, and Prometheus where metrics exist.
- Agents query that evidence through Grafana MCP.
- The system identifies bad tool mix, brittle skills, weak routing, or shell-heavy workflows that keep producing avoidable mistakes.
- Agents or operators adjust prompts, agent configs, skill descriptions, routing rules, or tool access.
- The next session produces a new telemetry shape, and the cycle repeats.
That is how you move from “interesting dashboard” to “measurable improvement system.”
The goal is not to maximize one tool category. It is to land on the right mix of CLI, built-in tools, MCP calls, and skills for the work actually being done.
What This Lets Us Answer
Once both runtimes land in the same Grafana stack, we can answer operational questions much faster:
- Are failures concentrated in one tool family?
- Are shell-heavy workflows creating avoidable mistakes where a higher-level tool should exist?
- Which MCP servers are carrying the workload?
- Are we paying for agent activity that is not producing meaningful progress?
- Is a session unhealthy because of the model, the tools, or the orchestration layer?
This is especially useful in multi-agent workflows, where “the agent was busy” tells you almost nothing.
If one specialist keeps getting dispatched and producing high failure rates, that is a routing or prompt-shaping problem.
If one MCP server dominates all calls, that may be good architecture or a sign that everything else is dead weight.
If tool failures spike while cost stays high, you have an operational problem, not a quality problem.
If shell work keeps failing in predictable, avoidable ways where a higher-level tool should exist, that is a product signal.
If one skill activates constantly but does not improve outcomes, that is a prompt or routing signal.
The Real Lesson
The deeper lesson here is that agent observability needs both runtime telemetry and workflow telemetry.
Runtime telemetry tells you what the system did.
Workflow telemetry tells you what the agent thought it was doing.
We need both.
If you only keep traces and counters, you miss the semantic layer. If you only keep hook events, you miss latency, spans, and the broader runtime picture.
And if you keep both but never feed them back into the agent layer, you have monitoring, not adaptation.
The combination is what makes the system explainable enough to operate and tunable enough to improve.
What’s Still Imperfect
There are still rough edges.
- Not every hook event includes the duration and token data we would like.
- Some of the best timing views still come from Tempo traces, not the hook logs.
- Codex today is less semantically rich than Claude Code in the enriched event stream.
- The dashboard screenshot is a live operations surface, not a polished marketing artifact.
That last point is intentional. We would rather show the real instrument panel than pretend agent systems are magically self-explanatory.
Why This Matters For Maguyva
Maguyva is about giving agents better code intelligence. But once agents are actually doing useful work, a new requirement appears immediately: you need to see how they are behaving.
Search quality, routing quality, tool selection, and context efficiency all become observable problems.
That is why we think this is worth writing about. The future agent stack is not just prompts and tools. It is prompts, tools, and the instrumentation layer that tells you whether the whole thing is working.
If you are building serious agent workflows, observability is not optional infrastructure. It is part of the product.
Related reading
More from the Maguyva build log
Why We Upgraded Code Search to voyage-4-large_
We moved our code embeddings to voyage-4-large — currently top of the public RTEB code retrieval leaderboard. The honest version: the trade we make, what we actually index, and why we pay for premium embeddings.
Language Recursive Self-Improvement: Grinding Code Intelligence Across ~280 Languages_
We support code intelligence for ~280 languages. No human can hand-audit that. So we built a language recursive self-improvement loop — spot-check, LLM-as-judge, fix one thing, re-validate — and run it with a fleet of isolated agents until extraction is actually right, not just green.
Multi-Modal Fusion Search: Picking the Right Retriever For Every Query_
A query like 'where is parseConfig defined' wants a different search than 'how does auth work'. Maguyva classifies the intent, weights four retrieval modalities accordingly, and fuses the results with weighted Reciprocal Rank Fusion.